
You wouldn’t expect a computer to be able to make up a funny joke—it seems like a uniquely human ability. In order for a computer to understand the jokes that it is making, it would need to have deep semantic understanding of words, which is infeasible. And it can be difficult to explain why a joke is funny.
However, it is feasible to use factor graphs to define a relatively simple model for what makes a specific class of jokes funny. A computer can then apply this methodology to make funny jokes, although it will not understand them.
Mathematicians can use factor graphs to represent the factorisation of a function. As an example, suppose we have the function
\begin{equation*} f(X_1, X_2, X_3) = X_1 (X_1 + X_2 + X_3). \end{equation*}
Then $f$ can be factorised as \begin{equation*} f(X_1, X_2, X_3) = g(X_1) h(X_1, X_2, X_3), \end{equation*} where $g(X_1) = X_1$ and $h(X_1, X_2, X_3) = X_1 + X_2 + X_3$. The factor graph for $f$ is:

It shows how $f$ can be factorised, and which variables appear in each factor. To make the graph, we label the factors in square boxes, the variables in circular boxes, and connect a variable to a factor if that variable is a term in the factor.
Factor graphs are useful for representing the factorisation of probabilities and they aid in visualising and piecing together the model’s connections. As another example, the combined probability that there will be rain on Monday and Tuesday ($R_M$ and $R_T$) can be factorised as
\begin{align*} P(R_M, R_T) &= P(R_M) P(R_T \mid R_M) \\ &= f_1(R_M) f_2(R_M, R_T). \end{align*}
Factor $f_1$ determines whether it rains on Monday, and factor $f_2$ determines if it rains on Tuesday given that it rained on Monday. The factor graph is:

Unsupervised joke generation from big data, a paper by Saša Petrović and David Matthews from 2013, is one of the most cited papers on automated joke generation. It uses factor graphs to generate jokes of the form
For example:
The authors assumed that the probability that a joke of this form is funny is a function of its inputs, $(X, Y, Z)$. Technically the authors created a model for the probability that you would randomly choose the triple $(X, Y, Z)$ when choosing from a population of funny jokes. But we are interested in choosing triples that are likely to be funny. Fortunately, Bayes’ theorem tells us that the two quantities are proportional to each other. If $A$ and $B$ are random events, Bayes’ theorem says \begin{equation*} P(A \mid B) \propto P(B \mid A) P(A). \end{equation*}
We now let $A$ be the event that we choose the triple $(X, Y, Z)$, and let $B$ be the event that we choose a funny triple; so if a particular triple $(X, Y, Z)$ is more likely to be chosen by the model then its associated joke is more likely to be funny. Petrović and Matthews further assumed that $P(A \mid B)$ can be factorised using the factor graph below, which I will now go through.
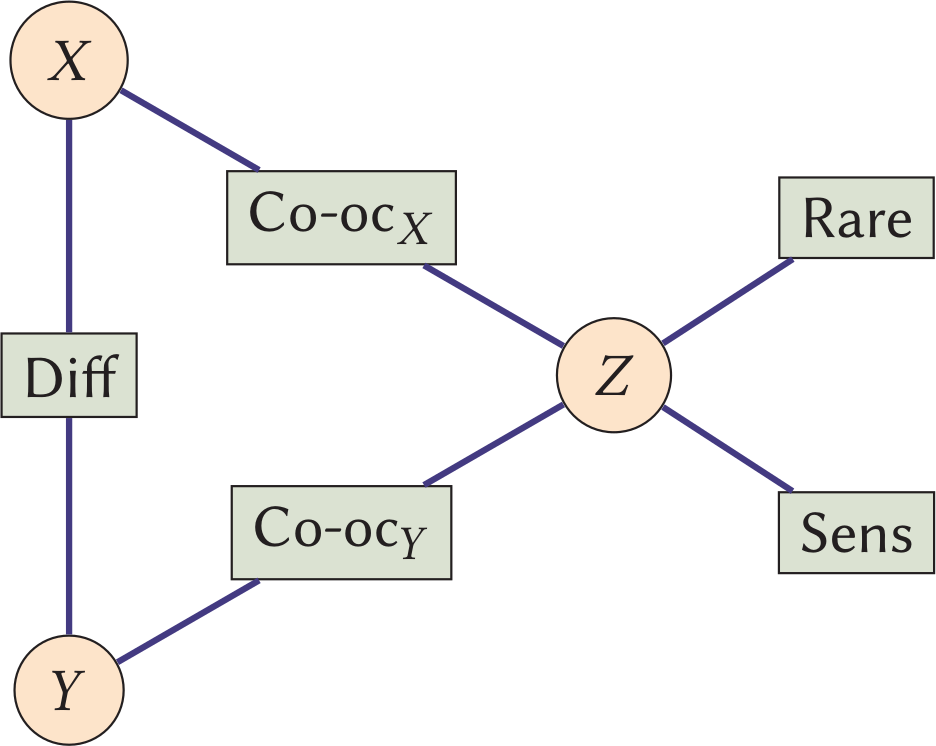
Factor 1: $\text{Co-oc}_{X}, \text{Co-oc}_{Y}$
A joke of the form ‘I like my $X$ like I like my $Y$: $Z$’ will only make sense if the adjective $Z$ is often used to describe $X$ and $Y$. Without this assumption we would get anti-jokes such as
The factor $\text{Co-oc}_X$ is a measure of the co-occurrence. If we are given non-random values $x, z$ then we can evaluate:
\begin{equation*} \text{Co-oc}_X(x, z) = \frac{f(x, z)}{\sum_{x^\prime, z^\prime} f(x^\prime, z^\prime)}, \end{equation*}
where $f(x, z)$ counts the number of times that adjective $z$ is used to describe $x$ in a large corpus (a collection of written works). Petrović and Matthews used the Google Ngram data set as their corpus. We divide $f(x, z)$ by the sum of $f(x^\prime, z^\prime)$ over all pairs $(x^\prime, z^\prime)$ in order to scale $\text{Co-oc}_X(x, z)$ to be in the interval $[0, 1]$, like a probability (it will be used like a probability in Factor 2). $\text{Co-oc}_Y$ is just the same but with $y$ replacing $x$.
Factor 2: $\text{Diff}(X, Y)$
‘I like my $X$ like I like my $Y$: $Z$’ will only work as a joke if $X$ and $Y$ are quite different nouns. Without this assumption we would get anti-jokes such as:
So the authors wanted to give a higher score to dissimilar nouns:
\begin{equation*} \text{Diff}(x, y) = \frac{1}{\textrm{similarity}(x, y)}, \end{equation*}
where the similarity function is estimated from the corpus. We set the probability of seeing the (noun, adjective) pair $(x, z)$ to be $p(x, z) = \text{Co-oc}_X(x, z)$, and then define
\begin{equation*} p(x) = \frac{f(x)}{\sum_{x^\prime} f(x^\prime)}, \end{equation*}
where $f(x)$ counts the number of occurrences of $x$ in the corpus. So $p(x)$ is the probability that we would choose $x$ if we chose a random word from the corpus. We also define
\begin{equation*} p(z \mid x) = \frac{p(x, z)}{p(x)}, \end{equation*}
so $p(z \mid x)$ is the probability that you have chosen adjective $z$, given that you chose a random (noun, adjective) pair from the data set and you see that you have chosen noun $x$. We define $p(y)$ and $p(z \mid y)$ similarly. The authors then chose a similarity function that resembles a correlation function between $X$ and $Y$:
\begin{equation*} \textrm{similarity}(x, y) = \frac{\sum_z p(z \mid x) p(z \mid y)}{\sqrt{\sum_z p(z \mid x)^2 \times \sum_z p(z \mid y)^2}}. \end{equation*}
If $x = y$ then $\textrm{similarity}(x, y) = 1$, and if $x$ and $y$ are commonly described using the same adjectives then the similarity will be close to $1$. And if $x$ and $y$ are very rarely described using the same adjectives then $\textrm{similarity}(x, y)$ will be close to $0$.
Factors 3 & 4: $\text{Rare}(Z)$ & $\text{Sens}(Z)$
The third factor encodes that the joke is funnier if $Z$ is not a common adjective. Without this assumption we would get anti-jokes such as:
The third factor is just defined as the reciprocal of the frequency of adjective $z$:
\begin{equation*} \text{Rare}(z) = \frac{1}{f(z)}.\end{equation*}The final factor encodes that the joke is funnier if $Z$ has many different senses. ‘I like my $X$ like I like my $Y$: $Z$’ jokes are often funny because one meaning of $Z$ is used for $X$ and another is used for $Y$. Without this assumption we would get anti-jokes such as:
Just because $Z$ is chosen to have multiple senses doesn’t guarantee that it will be used in different senses for $X$ and $Y$: it is just an approximation. The final factor is
\begin{equation*} \text{Sens}(z) = \textrm{senses}(z), \end{equation*}
where $\textrm{senses}(z)$ is derived from the Wordnet corpus. The probability that the authors chose a particular triple $(x, y, z)$ is then given by
\begin{equation*} \frac{\text{Co-oc}_X(x, z) \text{Co-oc}_Y(y, z) \text{Diff}(x, y) \text{Rare}(z) \text{Sens}(z)}{\sum_{x^\prime, y^\prime, z^\prime} \text{Co-oc}_X(x^\prime, z^\prime) \text{Co-oc}_Y(y^\prime, z^\prime) \text{Diff}(x^\prime, y^\prime) \text{Rare}(z^\prime) \text{Sens}(z^\prime)}, \end{equation*}
where we divide by the sum of all possible triples in order to make sure that the probabilities all sum to $1$. It was too expensive to compute the sum over all possible triples $(x, y, z)$ so the authors restricted themselves to some selected values of $x$, and for each of these they computed the conditional probability of $(X, Y, Z)$ given that $X = x$, which is computationally feasible. The authors tested their model, comparing the jokes that they generated to a random selection of jokes found on Twitter. A small panel judged that their method can generate funny jokes: 16.3% of the jokes generated by their model were found funny, compared to 33.1% for the Twitter jokes. Here are two of the jokes generated by their model:
In summary, factor graphs can be used to represent probability models, and these can also be used to generate jokes! Why not have a go at making your own jokes using these principles—Chalkdust would love to hear from you, especially if you come up with a good mathematical joke.
Update: There’s now a bot (created by Alex) on Mastodon that posts jokes in the “I like my A like I like my B: C”. You can follow it at @ilikemybot@botsin.space.
More from Chalkdust

In conversation with Trachette Jackson
We chat with Trachette about her work in mathematical oncology, her role models, and boosting diversity in mathematics
How to cheat at cards
Kevin Houston teaches us how to deal ourselves the best hand
Adopt a polyhedron
Mara Kortenkamp, Erin Henning and Anna Maria Hartkopf give us a tour of Polytopia, a home for peculiar polytopes
Kepler’s barrels
Sam Hartburn orders wine by the barrel, but wonders if she's getting the most wine
What can you do with this space?
Nobody could draw a space filling curve by hand, but that doesn’t stop Andrew Stacey
Weirdonacci numbers
Like Fibonacci, but weird. Robert J Low and Thierry Platini explain