
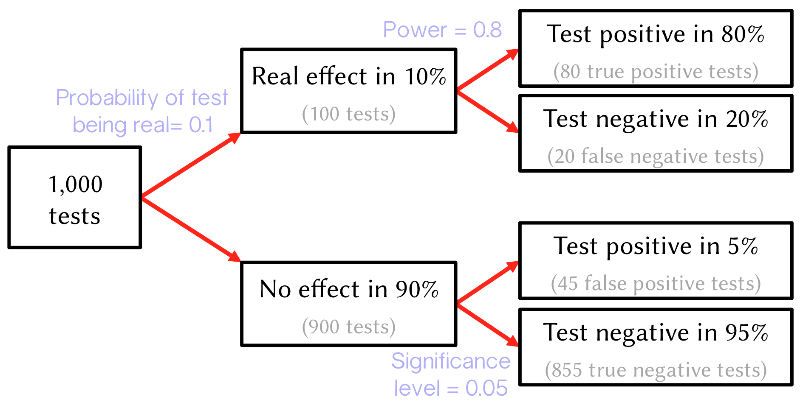
Tree diagram to illustrate the false discovery rate in significance tests. This example considers 1,000 tests, in which the prevalence of real effects is 10\%. The lower limb shows that with the conventional significance level, p=0.05, there will be 45 false positives. The upper limb shows that there will be 80 true positive tests. The false discovery rate is therefore 45/(45+80)=36\%, far bigger than 5\% (from Colquhoun, 2014).
More from Chalkdust

Dear Dirichlet, Issue 22
Rhythm, rivers and rises pollute the prof's postbag this issue
NEW! Pop-math book club
Do you have lots of unread pop math books on your shelves? Join our new monthly online book club!
Things to make
Platonic shapes from tube maps, flexagons, and more mathematical craft
What’s hot and what’s not

Optimal Pac-Man
Ghostbusting with graph theory
Reinventing 2D
What a difference a matrix makes