
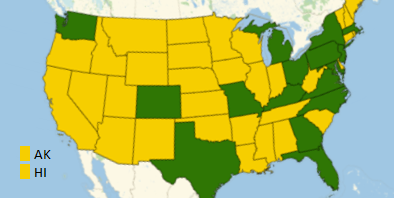
Image: US map in an extreme election scenario with two candidates and their respective electoral votes (EV) and popular votes (PV) in the table below. The winner is in yellow. Registered voters data from
More from Chalkdust

Sum Stories
We review the fifth of this year’s nominees for Book of the Year
In conversation with Shannon Trust
We find out more about the charity's work to support maths education in prisons.
In conversation with Martin Hairer
We talk to the Fields medallist about his life, his work and his advice to his younger self.
Page 3 model: The potato Earth
How Kelvin estimated the age of the Earth by thinking about a baked potato
Page 3 model: Woollen jumpers
How did your favourite sweater become so big? And how big can it get?
Significant figures: John Conway
The story of an unforgettable mathematician.