
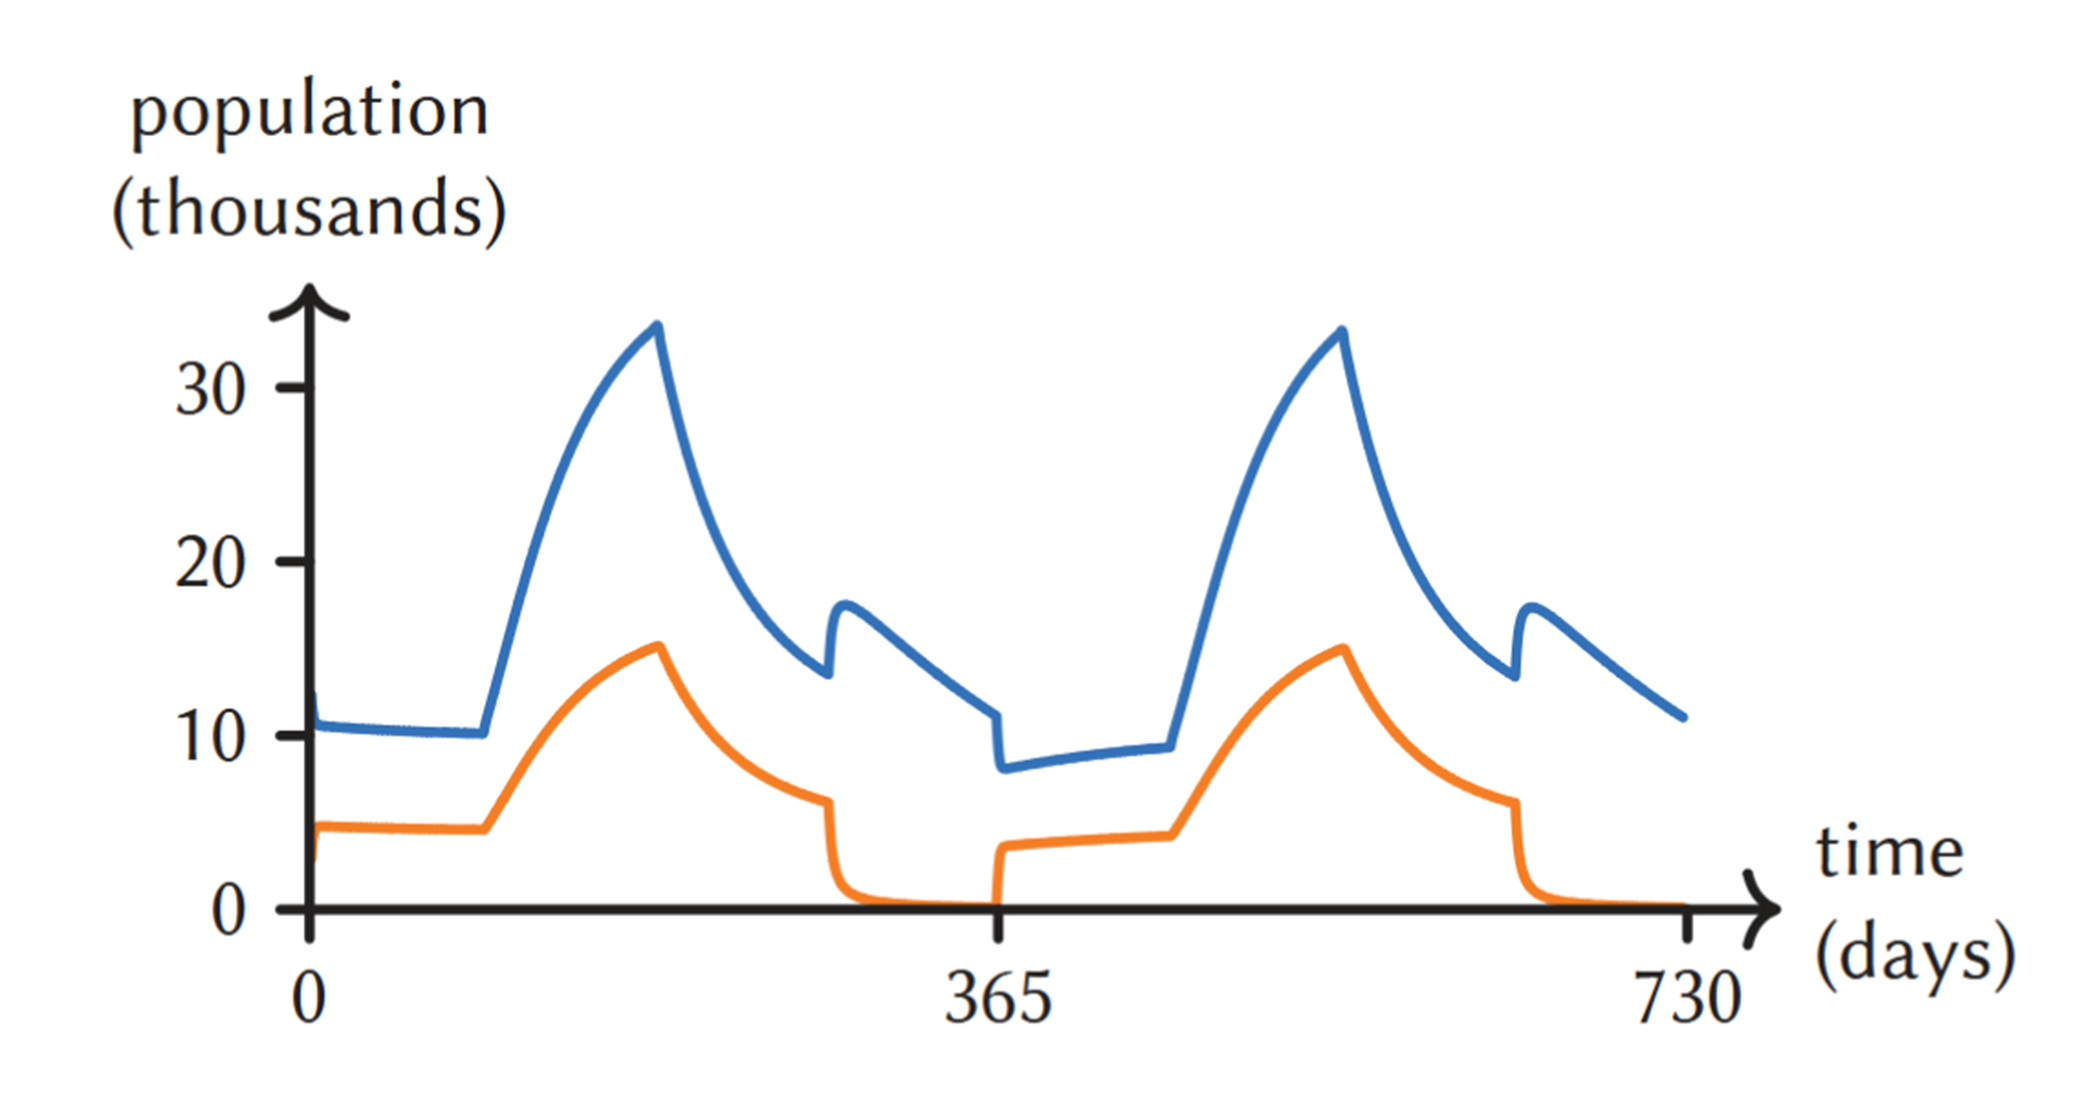

The number of hive (blue) and forager (orange) bees over time

More from Chalkdust

Solving a cubic in 1646
Elinor Flavell takes squaring the circle to another level
Review of “Getting Triggy with it”
Find out what we thought of Matt Parker's 2025 Edinburgh Fringe show
In conversation with Alison Etheridge
Elinor Flavell talks to the recently appointed dame about life, mathematics and more.
Weirdest Maths
We review the third of this year’s nominees for the Book of the Year
Oπnions: Should I share my code?
Scroggs debates whether sharing truly is caring
Dear Dirichlet Valentine’s Day special
Agony uncle Professor Dirichlet answers your personal problems this Valentine's Day.