
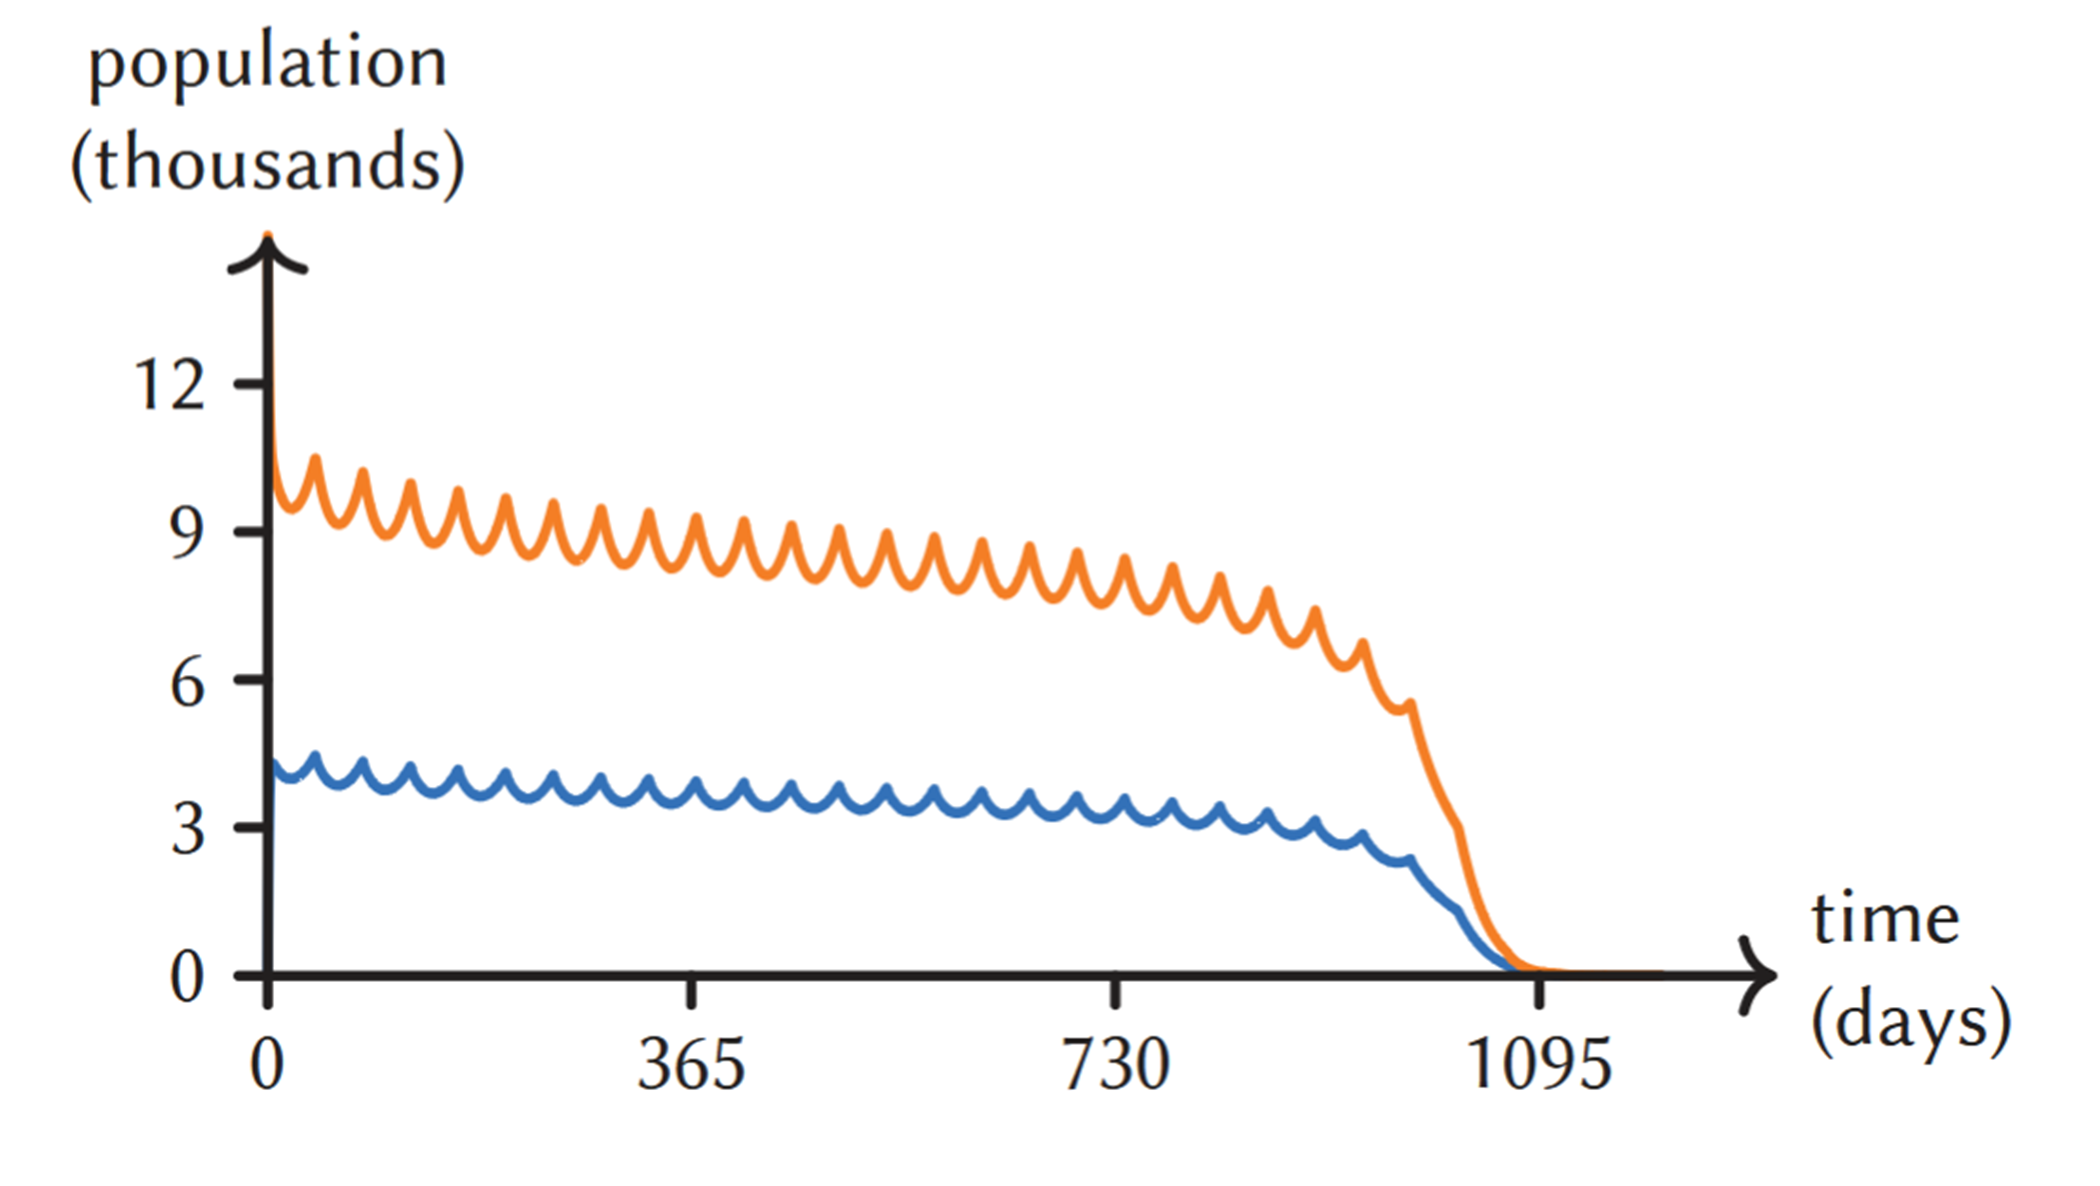

The number of hive (blue) and forager (orange) bees when spraying pesticides every 41 days (colony collapses)…

More from Chalkdust

Solving a cubic in 1646
Elinor Flavell takes squaring the circle to another level
Review of “Getting Triggy with it”
Find out what we thought of Matt Parker's 2025 Edinburgh Fringe show
In conversation with Alison Etheridge
Elinor Flavell talks to the recently appointed dame about life, mathematics and more.
What’s hot and what’s not, Issue 14
Fashion is fleeting, Chalkdust regulars are not.
Automated joke generation
I like my towns like I like my Alex: Bolton
Do you have too many or too few friends?
Do we have a natural limitation on the number of friends that we have?